A buyer gets your P&L on a Monday. By Tuesday morning, before they reply to your email, they have already opened your store page, read your last 40 reviews, and checked whether your rating has moved in six months. App store metrics are the first thing a serious buyer checks, and they shape the offer long before you get on a call.
Your financials tell a buyer what the app earned. Your store profile tells them whether it keeps earning after you hand over the keys. That second question is what sets your multiple.
Why App Store Metrics Decide Your Multiple
Apps in this market trade between 2x and 5x SDE. On an app throwing off $200k a year in profit, that spread is $600k. Almost none of it comes from the revenue line.
It comes from how confident the buyer is that the revenue survives the handover. That confidence gets built or destroyed on your store page.
Average iOS retention is 25.4% on day one and 5.3% by day 30, according to Business of Apps. Android sits lower at 20.2% and 3.8%. A buyer knows those numbers cold, and if your listing suggests you are below them, they price the decline into the offer. It is the same logic behind mobile app retention metrics moving valuations more than MRR ever does.
Ratings and Review Velocity Are the First Filter
79% of users check an app’s rating before they download it, per Business of Apps research on ratings and reviews. Buyers know that. Your rating is not a vanity number to them, it is a forward-looking revenue input.
Below 4.0, expect questions. Below 3.5, expect a discount or a pass.
Velocity matters as much as the average. An app with 12,000 lifetime ratings and four new ones this month reads as a business in decline, whatever the P&L says. Buyers also check whether the rating climbed or slipped across your last three releases.
Read your last 50 reviews before a buyer does. If three of them name the same bug, fix it and ship. A rating trending up during diligence is one of the cheapest things you can hand a buyer.
Conversion Rate: Where Listings Quietly Lose Money
AppTweak put the average US store page conversion rate at 8.56% on the App Store and 16.15% on Google Play. The average App Store install rate, meaning downloads straight out of search and browse results, was 3.8%.
If your conversion sits under your category median, a buyer reads two things at once. Present performance is weak, and there is upside sitting there that they can capture without paying you for it.
That second read is the expensive one. Growth a buyer believes they can create themselves gets taken straight out of your price. Fixing your first screenshot and the opening two lines of your description before you list keeps that value on your side of the table.
Download Trend and How Much of It You Are Paying For
Buyers split organic downloads from paid installs on the first pass. An app doing 40,000 monthly downloads on zero spend is a different asset than one doing 40,000 on $18k of user acquisition, even at identical profit.
Show a 12-month download chart next to your spend. If downloads are flat while spend climbs, say it before the buyer finds it. Getting ahead of a soft number costs you far less than having it surface in due diligence.
Keyword rankings belong in the same file. A top-five position on a high-volume search term is a moat, and you should price it as one. App store optimization work you did two years ago is still an asset today.
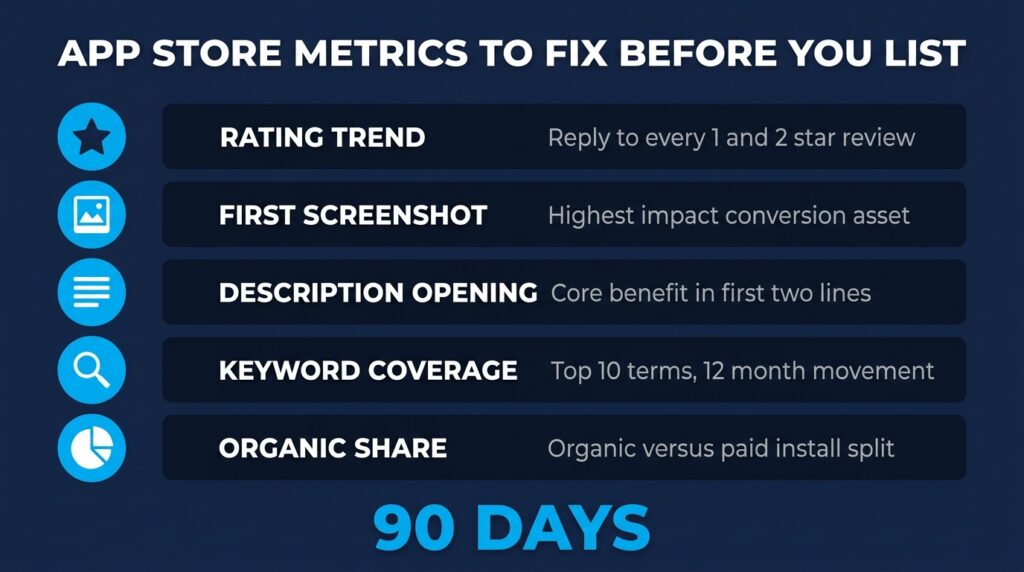
The App Store Metrics to Fix Before You List
Ninety days is enough to move most of this. Here is where the return is highest.
- Rating trend. Reply to every 1-star and 2-star review from the last 90 days. Response volume alone lifts sentiment.
- First screenshot. Test one new lead screenshot. It is the highest-impact conversion asset on the page.
- Description opening. Put the core benefit in the first two lines. Most users never tap “more”.
- Keyword coverage. Pull your top 10 terms and their 12-month ranking movement into one sheet.
- Organic share. Document the organic versus paid install split month by month.
None of this is cosmetic. Each line is something a buyer pulls up before they decide what your app is worth, and each one feeds the multiple they apply to your profit. If you want the full picture on how that multiple gets set, start with how to calculate what your app is worth.
Common Questions About App Store Metrics and Valuation
Do buyers care more about ratings or revenue? Revenue sets the base number. Ratings and retention set the multiple applied to it. A 4.6-star app and a 3.4-star app with identical profit do not get identical offers.
How far back do buyers look? Twelve months minimum on downloads, ratings, and revenue. Anything shorter reads like you are hiding a quarter.
Can I improve these fast enough to matter? Conversion and rating trend respond in weeks. Retention takes months. Start with the fast ones and work backwards from your target list date, which is covered in this step-by-step guide to selling a mobile app.
Your store page is the only part of your business a buyer can inspect without asking permission. They will look at it before your first call, and the app store metrics they find there set the ceiling on the conversation.
Fix what you control, document what you cannot, and go to market with the story already told. If an exit is on your mind for the next 12 months, get an honest read on what your app is worth before you start polishing anything.