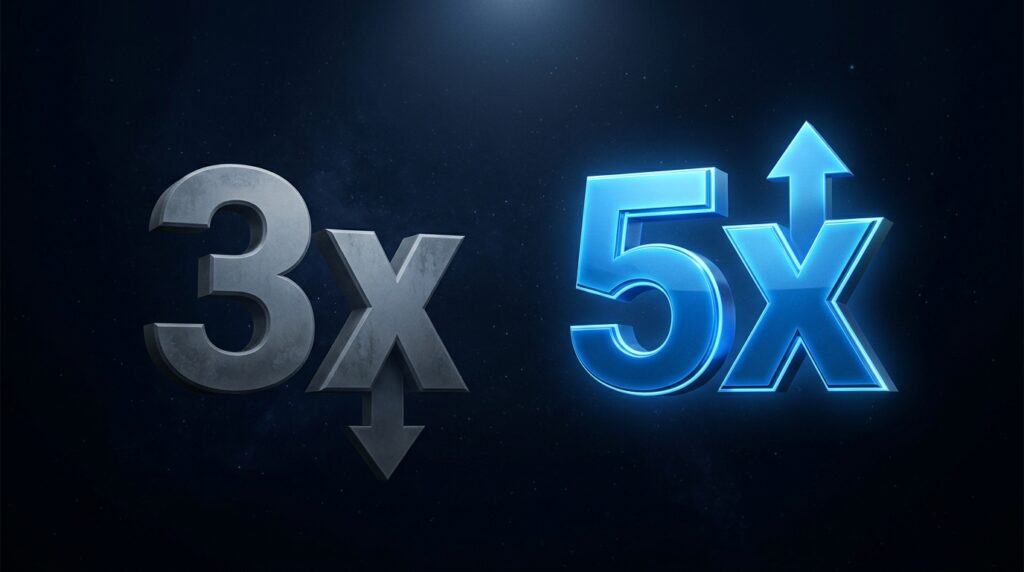
Two buyers looked at the same subscription app doing $18k a month in profit. One offered 3.1x. The other offered 4.4x. Same P&L, same retention curve, same review history.
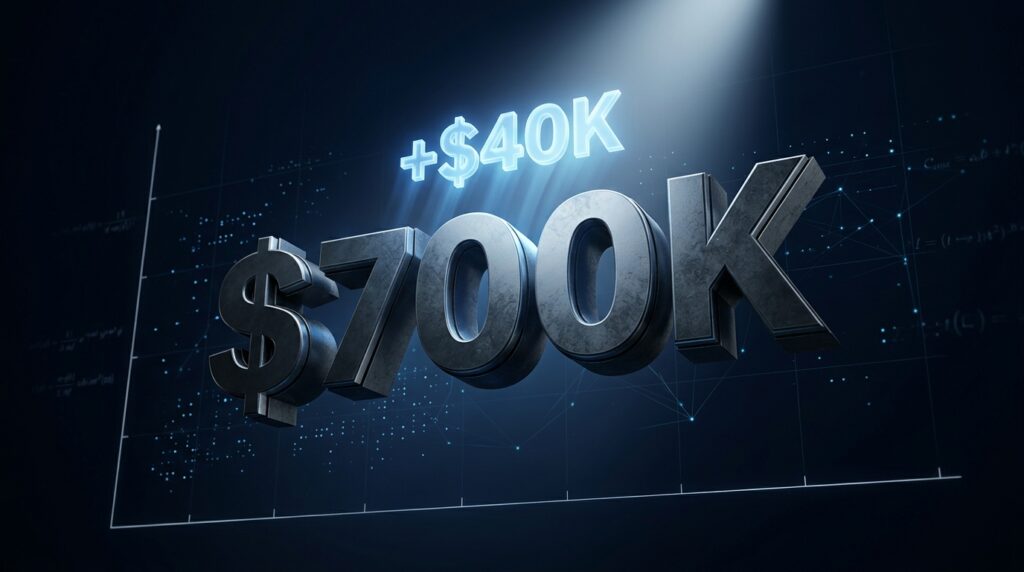
The gap was roughly $280k, and almost none of it was about the app. It was strategic vs financial buyer math, and once you see how each side builds a number, offers stop feeling random.
Most founders picture the buyer pool as one crowd with one price. It is two crowds with two completely different reasons to write the check.
What Separates a Strategic vs Financial Buyer
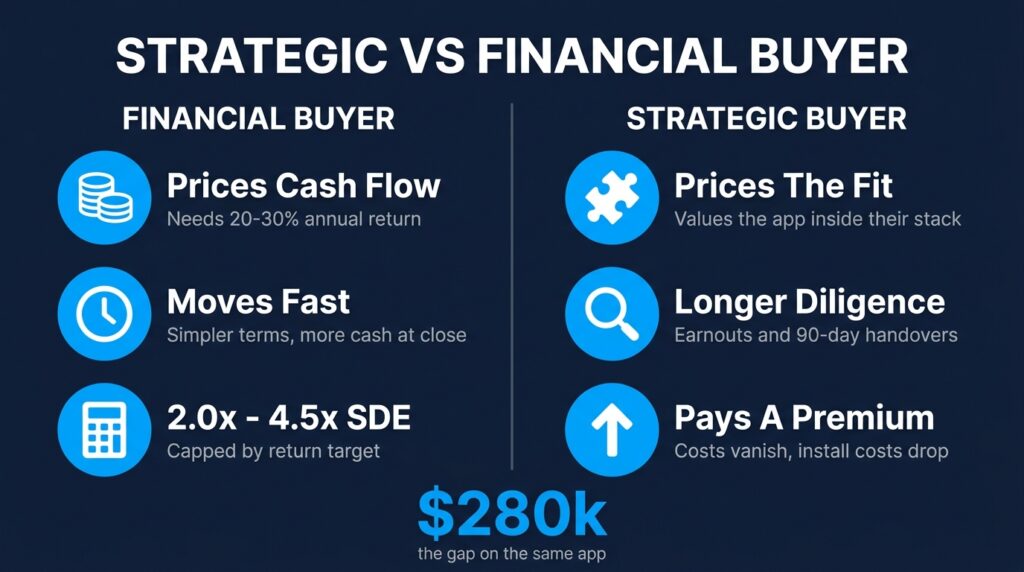
A financial buyer is buying cash flow. They want an asset that pays them without their hands on it every day, so they price it off what it earns right now.
Search funds, small holdcos, portfolio investors, most solo acquirers. Their question is short: how fast do I get my money back?
A strategic buyer is buying a piece that slots into something they already run. A studio with a live-ops team sitting idle.
A portfolio operator with a user acquisition engine already spending six figures a month. A publisher who wants your category ranking before a competitor takes it.
Their question is different: what is this app worth once it is inside my machine? That question can produce a much bigger number. It can also produce a much smaller one when the fit is not there.
How Each Buyer Builds the Number
Financial buyers work backwards from a return target. Most need 20% to 30% annually after fees and expenses to justify the deal. That target caps what they can pay no matter how much they like your app.
For owner-operated apps under roughly $5M, that math usually lands on SDE multiples of 2.0x to 4.5x, moved up or down by app age, transferability, and platform concentration. If you want the underlying arithmetic, our mobile app valuation guide walks through it line by line.
A strategic buyer starts from the same P&L, then adds everything that changes on day one after close. Your $3k a month in servers and tooling disappears into infrastructure they already pay for.
Your blended install cost drops because their media buyers work at a scale you never could. Your app gets cross-promoted to a few million existing users for free.
Now your $18k a month reads as $26k a month in their model. They are not paying 4.4x for your business. They are paying about 3x for theirs.
Why Strategic Buyers Pay a Premium
The clearest version of this plays out at the top of the market. Games industry M&A hit $7.7bn across 52 deals in Q1 2026, and one transaction was most of it: Savvy Games Group agreeing to buy Moonton for $6bn.
Nobody underwrites a $6bn cheque on cash-on-cash return. Savvy has a mandate to deploy close to $38bn into gaming and make Saudi Arabia a centre of the category. That is a strategic buyer paying for position, not for profit.
Your app is not Moonton. The logic is identical at every size. When the buyer gets something beyond the P&L, the P&L stops being the ceiling.
We broke down a smaller version of this in why two buyers offered $180k apart for the same app, and buyer type was the entire story there too.
When the Financial Buyer Is the Better Deal
In the strategic vs financial buyer comparison, a bigger headline number is not the same as a better exit. Strategic buyers run longer diligence because they are checking fit, not just accuracy. They ask for transition periods, earnouts, and handovers that can stretch past 90 days.
Financial buyers move faster. Simpler terms, more cash at close, and far less of your calendar attached to the deal after the wire lands. When two offers sit within 10% of each other, the cleaner one usually wins on what you actually keep, which is a point we make in our breakdown of app deal structure.
Either way, the money moves through escrow. That part is not negotiable regardless of who is on the other side.
How to Get Both Types in the Room
In a strategic vs financial buyer race, you do not control which side values your app highest. You control whether both types ever see it.
Financial buyers need clean books. Twenty-four months of P&L, revenue split by store and by product, costs that reconcile to bank statements. Anything unexplained becomes a discount.
Strategic buyers need a fit story. Which of their existing titles shares your audience, what your category ranking is worth to them, which of your costs vanish inside their stack. Nobody builds that case for you, and a strategic buyer scanning a public listing will not build it either.
That is why the buyer pool matters more than the listing page. Public marketplaces are dominated by financial buyers running the same return model, and the three types of buyers active in 2026 pay very differently for the same asset.
Reach one group and you get one price. Reach both and you get a real market.
The Number Depends on Who Is Reading It
The strategic vs financial buyer split is the reason two honest offers on the same app can sit six figures apart. Neither buyer is wrong. They are answering different questions with the same spreadsheet.
Your job before you go to market is to know which question your app answers best, then make sure the buyers asking it actually hear about you. That is the difference between one offer and a decision. If you have not mapped the process yet, start with how to sell your app before either buyer type sees your numbers.
If you want an honest read on which buyer type pays most for your app, start here.